Last updated on January 10, 2022
Workout Wednesday is a Tableau community led weekly challenge to re-create existing non-trivial visualisations. I personally enjoy this initiative and cannot recommend it enough for everyone who wants to level up skills, learn new visualization techniques and never miss recently released Tableau features.
In this post I want to share the most exciting functionalities and tricks I’ve came across while completing Workout Wednesday 2021 challenges.
1. Automatic Marks Deselection
By default, if you click on any mark on the viz, the rest of the chart remains visible but greyed out. That works well for Filter dashboard action. However, with Parameter and Set actions being used more and more frequently, this feature turned into being more annoying than useful.
What I like about Tableau is that there is always a workaround, and Tableau community has already found some elegant solutions to get rid of the selection. The most commonly used ones involve Highlight action and Filter action, the latter being the most versatile.
Below you can see a few examples of the difference those tricks make.
Highlight action
Click to open in Tableau Public
Filter action
Click to open in Tableau Public
Feeling excited? Why not try Workout Wednesday Challenges yourself? I personally recommend WOW2021W24, WOW2021W40 and WOW2021W42.
2. Creative Formatting
When you are dashboarding around almost every day, you might start wondering how to make each view unique and creative. While you can play around with different chart types, shapes and colours, the number formatting is the feature which is often underrated.
Before I came across WOW2021W6 and WOW2021W47, I was convinced that adding up ▲ and down ▼ arrows to the number is the cleverest usage of the 'custom' formatting. It appeared though that there is so much more you can do, from replacing entire number with the shape to showing date(!!!) as a measure in a text table.
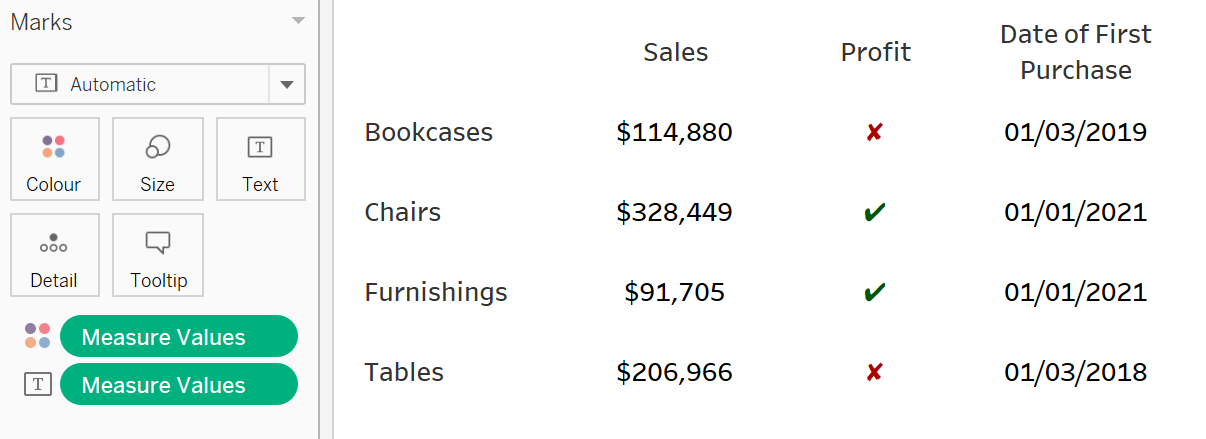
Click to open in Tableau Public
Check out this post to learn more about custom number formatting in Tableau.
3. Advance Totals and Subtotals
I have always considered Totals and Subtotals in Tableau to be easy to use and powerful, although not flexible enough feature. You can show them either on top or at the bottom, you can change the way those are computed, you can hardcode the header and that’s pretty much it.
And then it happened, the last challenge of 2021 which completely blew my mind. Can you identify Totals and Subtotals and apply another measure to them? Yes, you can, thanks to the SIZE() function.
Click to open in Tableau Public
Keeping in mind that for Grand Totals SIZE() is always 1, and for Subtotals it's either 1 or a number of panes (depending on the 'compute using' option) there is so much to play with, from customized dynamic headers (used in WOW2021W41 BTW) to parameterized calculation or aggregation method.
4. Good Old Table Calculations
Being a LOD fan, I have spent way too long trying to ignore Table Calculations existence. Catching up now, I am eager to find new ways I can use them in my vizzes. Luckily, there were lots of Table Calc opportunities in 2021 challenges and I want to share my favourite ones:
- Modified Marimekko chart in WOW2021W13 – try to use table calculations only.
- Scatterplot with a hidden timeline in WOW2021W21.
- Tricky but so rewarding Sales Tracker in WOW2021W38. Hint: this article might help a lot.
- Nice occasions to practice PREVIOUS_VALUE() in WOW2021W30 and WOW2021W34.
5. Map Layers
For the last couple of years my job did not involve dealing with geographical data a lot. The only time I’ve been creating maps was when I’ve been teaching how to create a map in Tableau. So, I am grateful that I have not missed Map Layers when they were introduced, thanks to the WOW2021W19, WOW2021W9 and WOW2021W24 challenges.
Why I am so hyped about the functionality I barely use? Because Map Layers opened a huge opportunity to go beyond Dual Axis and add a new lever of creativity to the variety of chart types, from Sunburst Chart to stunning KPIs.
Check my examples below:
Superstore Sales by Category
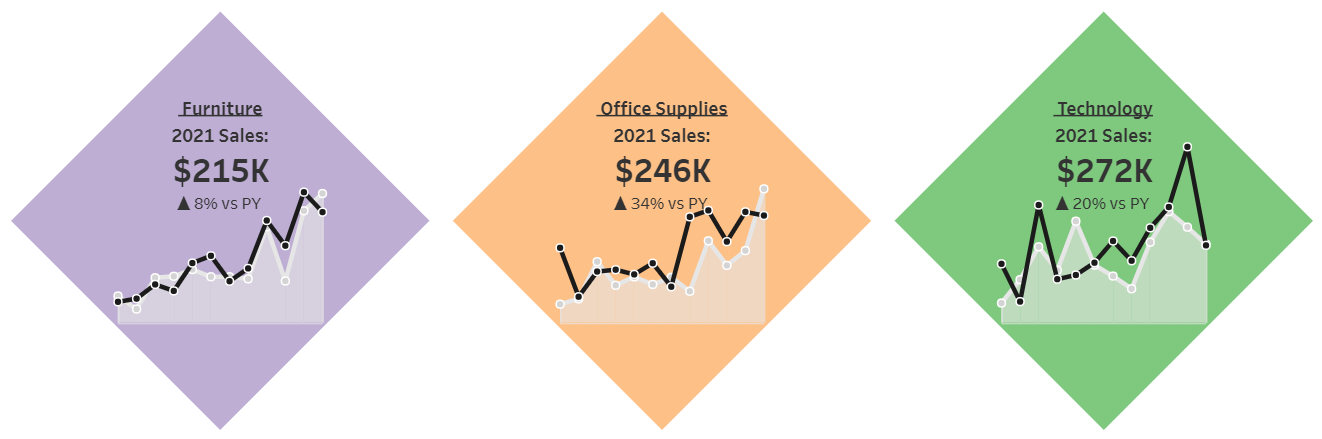
Click to open in Tableau Public
Superstore Sunburst Chart
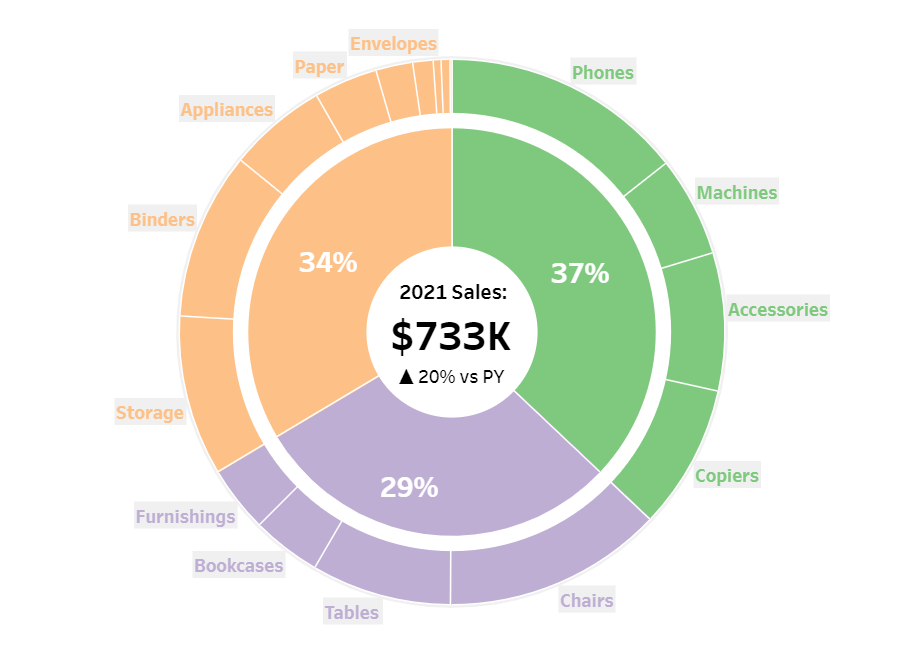
Click to open in Tableau Public
Thanks for reading, feel free to keep in touch if you have any questions and, in the meantime, happy dashboarding!